

(Image credit: Shutterstock)
Our CPU benchmarks performance hierarchy ranks current and previous-gen Intel and AMD processors based on performance, including all of the best CPUs for Gaming. Below the CPU ranking charts and tables, this guide also gives you a basic introduction to CPU benchmarks and includes a list of commonly-used CPU benchmarks. We have benchmarked CPUs for over 25 years, so we've preserved many of our legacy historical CPU rankings on the second page of this article.
Your CPU is considered a computer's most important component. CPU benchmark comparisons help us sort out the differences between chips, but you'll find a dizzying collection of model numbers and specs from both Intel and AMD. We've listed the best cheap CPUs and best CPUs for workstations and even covered the Intel vs AMD feature debate in other articles, but if you want to know the CPU rankings and how you can run CPU benchmarks of your own, this CPU benchmarks hierarchy is for you.
The $480 Ryzen 9 9800X3D is now the fastest gaming chip money can buy, but the previous-gen $460 Ryzen 7 7800X3D is a relatively close second that can often be found at lower pricing. The eight-core 16-thread chips use AMD's 3D V-Cache technology to accelerate gaming performance, but the tech doesn't accelerate all games and results in reduced performance in some applications. However, for gaming, AMD's 3D V-Cache tech is the uncontested leader.
Intel's Arrow Lake delivers class-leading single-threaded performance and impressive multi-threaded performance, but it lags comparably priced competing chips in gaming. Intel says it will soon deliver a combination of firmware and operating system patches that will rectify the situation. Those should arrive around the first week of December 2024, at which time we'll refresh the rankings below with fresh testing data.
We'll explain how we ranked the processors under each table. The game testing ranking is first. We also include a productivity application performance metric, which we've split up into single- and multi-threaded measurements. We also have an integrated graphics CPU gaming benchmark ranking so you can see how AMD's APUs stack up to Intel's processors.
CPU Benchmarks Rankings 2024 - Windows 10 and Windows 11
(Image credit: Tom's Hardware)
(Image credit: Tom's Hardware)
(Image credit: Tom's Hardware)
(Image credit: Tom's Hardware)
(Image credit: Tom's Hardware)
(Image credit: Tom's Hardware)
(Image credit: Tom's Hardware)
(Image credit: Tom's Hardware)
(Image credit: Tom's Hardware)
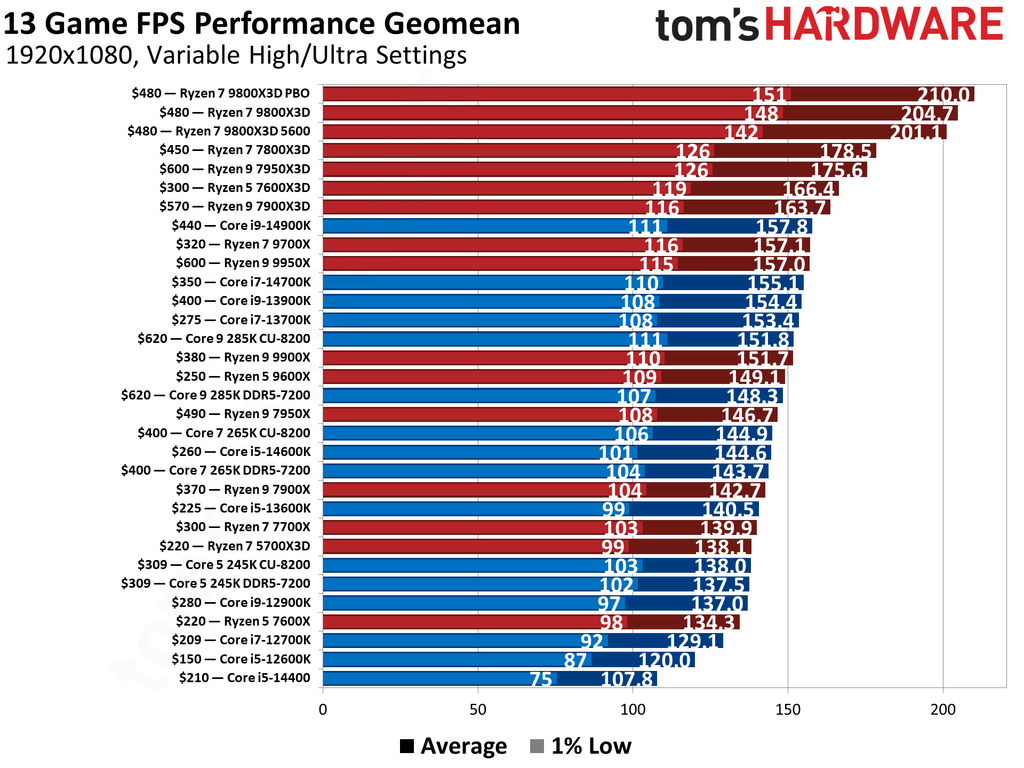
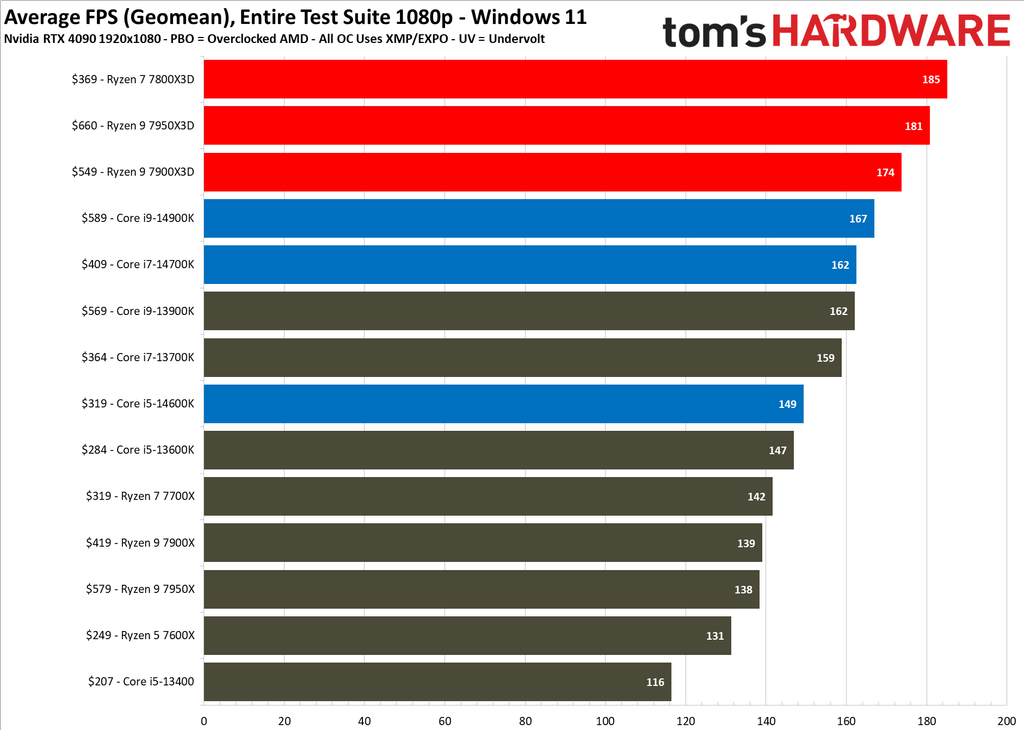
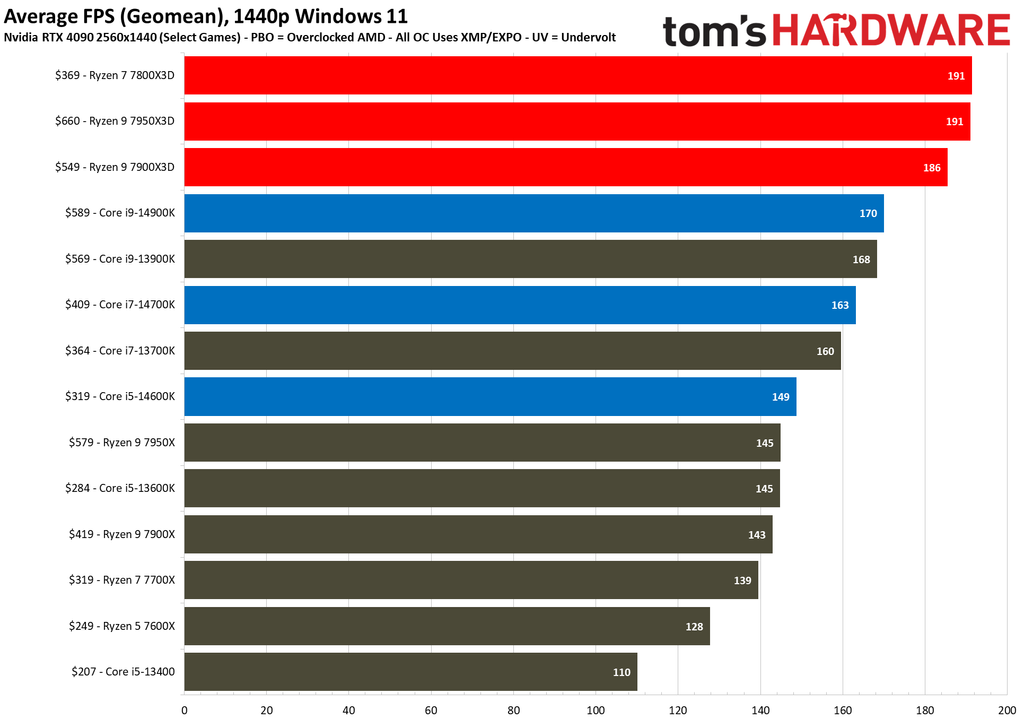
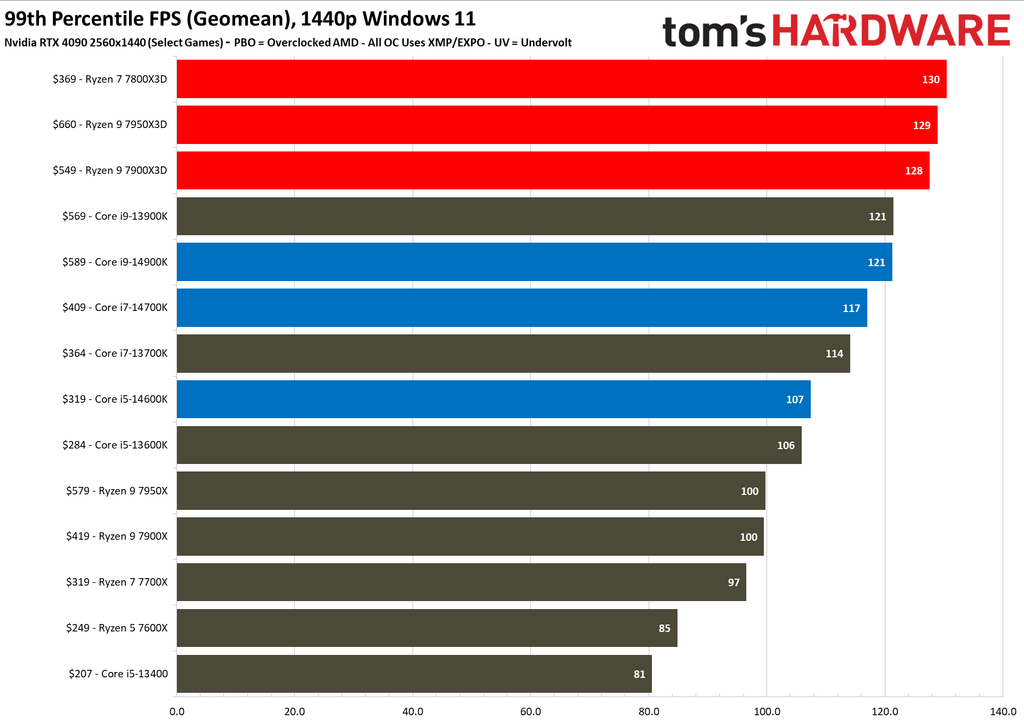
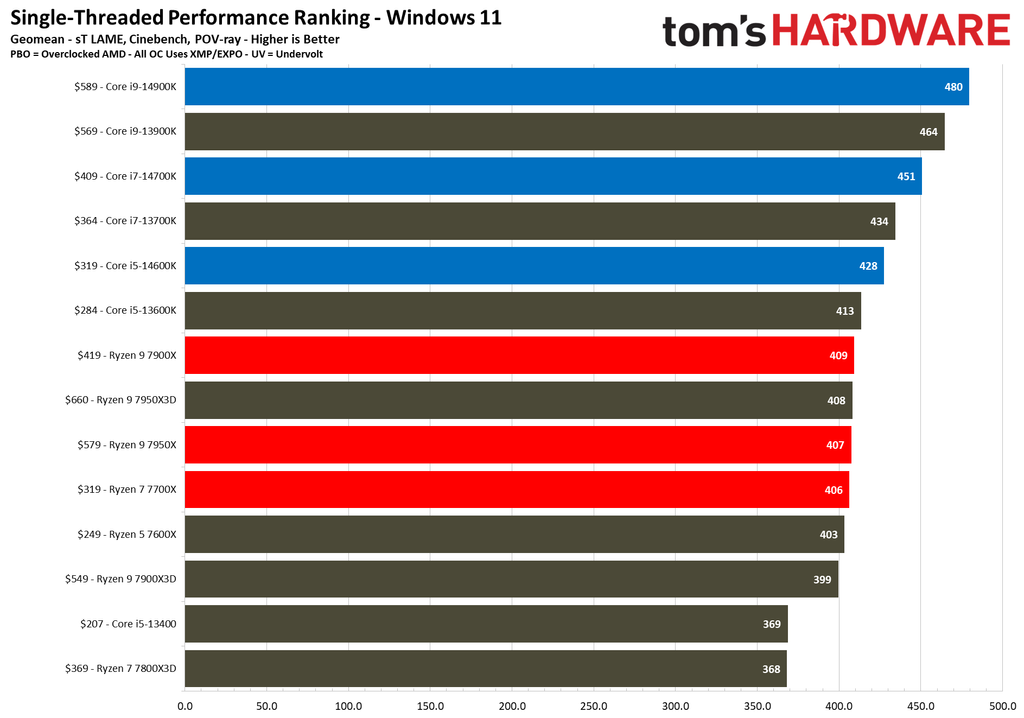
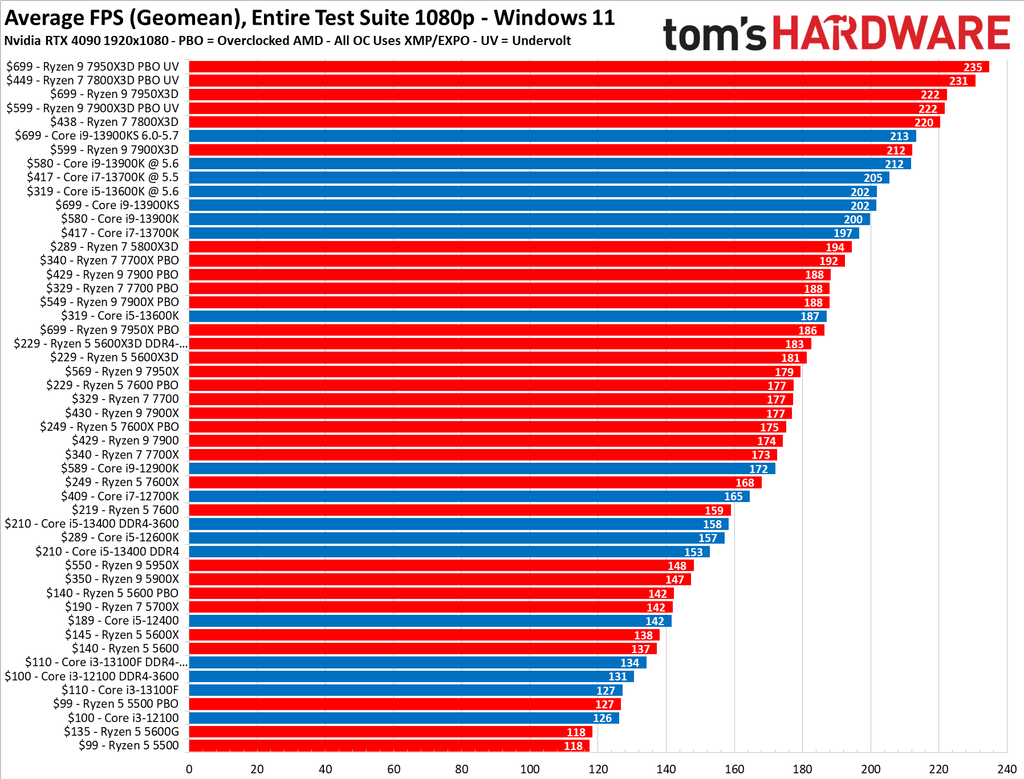
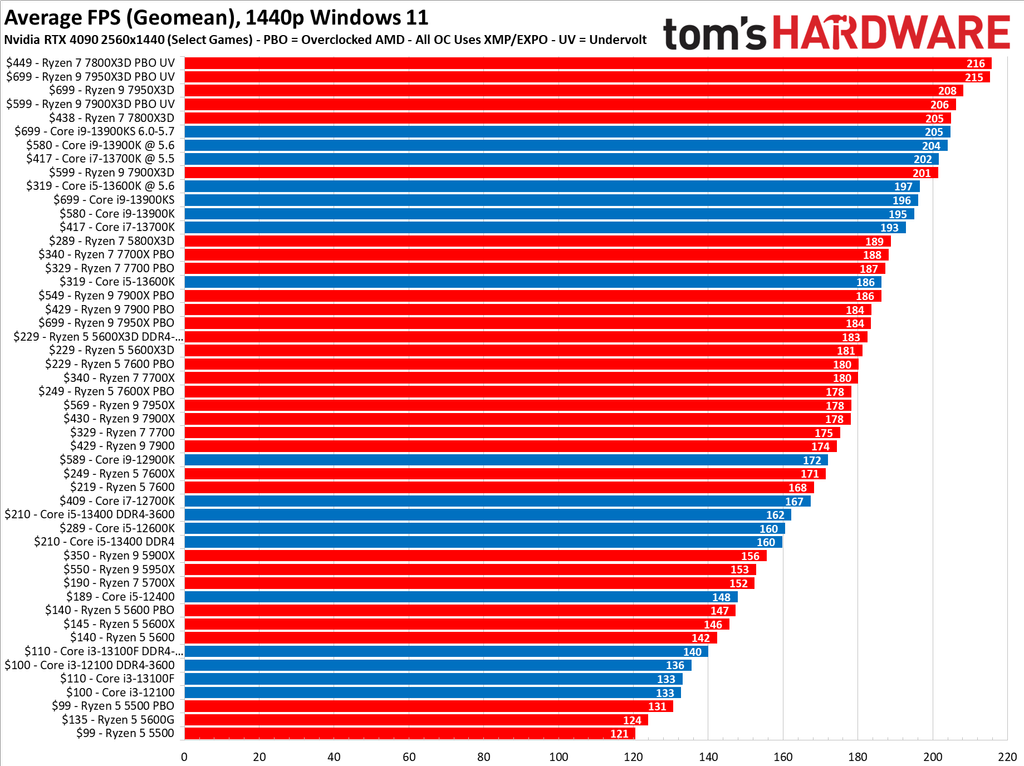
We have multiple sets of benchmarks in the album above. All of our tests above were conducted with the Nvidia GeForce RTX 4090. We recently updated our test image, so we have a limited selection of benchmarks that include the latest Intel and Ryzen processors (the first three charts). The following slides contain previous test pools, and you can use the relative positioning of the processors to gauge performance differences to older chips.
We rank all the Intel and AMD processors using the Windows 11 and RTX 4090 test bench in the tables below, but we don't include CPU overclock performance rankings. We've also added separate charts for integrated graphics testing below.
Bear in mind that the charts above use the raw performance numbers, whereas our CPU benchmarks rankings in the tables below use a score to rank the chips relative to one another. Here are also a few of our faceoffs that pit top gaming CPUs head-to-head:
- AMD Ryzen 7 7800X3D vs Intel Core i9-13900K vs Core i7-13700K: Big Gaming Punch, Smaller Price Tag
- AMD Ryzen 9 7950X3D vs Intel Core i9-13900K Faceoff: Battle of the Gaming Flagships
- Intel Core i5-13600K vs AMD Ryzen 7 7700X and Ryzen 5 7600X Face Off
- AMD Ryzen 9 7950X vs Intel Core i9-13900K Face Off
- Ryzen 7 5800X3D vs Core i7-12700K and Core i9-12900K Face-Off: The Rise of 3D V-Cache
Gaming CPU Benchmarks Ranking 2024
| Product / (MSRP) | Lowest Price | 1080p Gaming Score | Architecture | Cores/Threads (P+E) | Base/Boost GHz | TDP / PBP / MTP |
|---|---|---|---|---|---|---|
| Ryzen 7 9800X3D ($480) | No Stock | 100.00% | Zen 5 | 8 / 16 | 4.7 / 5.2 | 120W / 162W |
| Ryzen 7 7800X3D ($449) | $449 | 87.18% | Zen 4 | 8 / 16 | 4.2 / 5.0 | 120W / 162W |
| Ryzen 9 7950X3D ($699) | No Stock | 85.75% | Zen 4 | 16 / 32 | 4.2 / 5.7 | 120W / 162W |
| Ryzen 5 7600X3D ($299) | Microcenter | 81.30% | Zen 4 | 6 / 12 | 4.1 / 4.7 | 65W / 88W |
| Ryzen 9 7900X3D ($599) | $609 | 79.94% | Zen 4 | 12 / 24 | 4.4 / 5.6 | 120W / 162W |
| Core i9-14900K ($549) | $433 | 77.10% | Raptor Lake Refresh | 24 / 32 (8+16) | 3.2 / 6.0 | 125W / 253W |
| Ryzen 7 9700X ($359) | $324 | 76.74% | Zen 5 | 8 /16 | 3.8 / 5.5 | 65W / 88W / 105W |
| Ryzen 9 9950X ($649) | $564 | 76.67% | Zen 5 | 16 / 32 | 4.3 / 5.7 | 170W / 230W |
| Core i7-14700K ($409) | $315 | 75.76% | Raptor Lake Refresh | 20 / 28 | 3.4 / 5.6 | 125W / 253W |
| Core i9-13900K ($589) | $542 | 75.40% | Raptor Lake | 24 / 32 (8+16) | 3.0 / 5.8 | 125W / 253W |
| Core i7-13700K ($275) | $329 | 74.94% | Raptor Lake | 16 / 24 (8+8) | 3.4 / 5.4 | 125W / 253W |
| Core 9 285K CU-8200 | DDR5-7200 ($589) | $599 | 74.17% | 72.45% | Arrow Lake | 24 / 24 (8+16) | 3.7 / 5.7 | 125W / 250W |
| Ryzen 9 9900X ($499) | $409 | 74.09% | Zen 5 | 12 / 24 | 4.4 / 5.6 | 120W / 162W |
| Ryzen 5 9600X ($279) | $245 | 72.81% | Zen 5 | 6 / 12 | 3.9 / 5.4 | 65W / 88W |
| Ryzen 9 7950X ($569) | $523 | 71.65% | Zen 4 | 16 / 32 | 4.5 / 5.7 | 170W / 230W |
| Core 7 265K CU-8200 | DDR5-7200 ($394) | $379 | 70.77% | 70.17% | Arrow Lake | 20 / 20 (8+12) | 3.9 / 5.5 | 125W / 250W |
| Core i5-14600K ($319) | $224 | 70.61% | Raptor Lake Refresh | 14 / 20 | 3.5 / 5.3 | 125W / 181W |
| Core i5-13600K ($225) | $250 | 68.64% | Raptor Lake | 14 / 20 (6+8) | 3.5 / 5.1 | 125W / 181W |
| Ryzen 9 7900X ($474) | $398 | 69.71% | Zen 4 | 12 / 24 | 4.7 / 5.6 | 170W / 230W |
| Ryzen 7 7700X ($349) | $314 | 68.33% | Zen 4 | 8 / 16 | 4.5 / 5.4 | 105W / 142W |
| Ryzen 7 5700X3D ($229) | $230 | 67.46% | Zen 3 | 8 / 16 | 3.0 / 4.1 | 105W / 142W |
| Core 5 245K CU-8200 | DDR5-7200 ($309) | $319 | 67.39% | 67.18% | Arrow Lake | 14 / 14 (6+8) | 4.2 / 5.2 | 125W / 250W |
| Core i9-12900K ($589) | No Stock | 66.92% | Alder Lake | 16 / 24 (8+8) | 3.2 / 5.2 | 125W / 241W |
| Ryzen 5 7600X ($249) | $198 | 65.62% | Zen 4 | 6 / 12 | 4.7 / 5.3 | 105W / 142W |
| Core i7-12700K ($209) | $197 | 63.06% | Alder Lake | 12 / 20 (8+4) | 3.6 / 5.0 | 125W / 190W |
| Core i5-12600K ($150) | $150 | 58.61% | Alder Lake | 10 / 16 (6+4) | 3.7 / 4.9 | 125W / 150W |
| Core i5-14400 ($225) | $191 | 52.67% | Raptor Lake Refresh | 10 / 16 (6+4) | 2.5 / 4.7 | 65W / 148W |
The most powerful chip gets 100 percent, and all others are scored relative to it. We tested all platforms that support DDR5 with the newer memory — in general, Intel's chips lose a few percentage points of performance with DDR4 memory (more testing here).
We're expanding this roster of gaming CPU benchmarks, so keep an eye out for our updates. For now, head to our legacy section on the next page for benchmarks of even older CPUs.
We measured performance for the 1080p CPU gaming benchmarks with a geometric mean of 13 titles: A Plague Tale: Requiem, Baldur's Gate 3, Borderlands 3, Cyberpunk 2077, F1 2024, Far Cry 6, Final Fantasy XIV, Hitman 3, Hogwarts Legacy, Microsoft Flight Simulator 2021, Spider-Man: Remastered, Starfield, Minecraft, and Watch Dogs Legion.
Single-Threaded CPU Benchmarks Rankings 2024
| Single-Threaded App Score | Architecture | Cores/Threads (P+E) | Base/Boost GHz | TDP / PBP / MTP | |
|---|---|---|---|---|---|
| $620 - Core 9 285K CU-8200 | DDR5-7200 | 100% | 99.9% | Arrow Lake | 24 / 24 (8+16) | 3.7 / 5.7 | 125W / 250W |
| $380 - Core 7 265K CU-8200 | 97.3% | Arrow Lake | 20 / 20 (8+12) | 3.9 / 5.5 | 125W / 250W |
| $440 - Core i9-14900K | 97.1% | Raptor Lake Refresh | 24 / 32 (8+16) | 3.2 / 6.0 | 125W / 253W |
| $600 - Ryzen 9 9950X | 94.0% | Zen 5 | 16 / 32 | 4.3 / 5.7 | 170W / 230W |
| $320 - Core 5 245K CU-8200 | DDR5-7200 | 93.7% | 93.3% | Arrow Lake | 14 / 14 (6+8) | 4.2 / 5.2 | 125W / 250W |
| $380 - Ryzen 9 9900X | 92.6% | Zen 5 | 12 / 24 | 4.4 / 5.6 | 120W / 162W |
| $440 - Core i7-14700K | 91.4% | Raptor Lake Refresh | 20 / 28 | 3.4 / 5.6 | 125W / 253W |
| $400 - Core i9-13900K | 91.1% | Raptor Lake | 24 / 32 (8+16) | 3.0 / 5.8 | 125 / 253W |
| $250 - Ryzen 5 9600X | 90.6% | Zen 5 | 6 / 12 | 3.9 / 5.4 | 65W / 88W |
| $320 - Ryzen 7 9700X | 90.1% | Zen 5 | 8 /16 | 3.8 / 5.5 | 65W / 88W / 105W |
| $275 - Core i7-13700K | 88.4% | Raptor Lake | 16 / 24 (8+8) | 3.4 / 5.4 | 125W / 253W |
| $480 - Ryzen 7 9800X3D | 88.1% | Zen 5 | 8 / 16 | 4.7 / 5.2 | 120W / 162W |
| $235 - Core i5-14600K | 87.0% | Raptor Lake Refresh | 14 / 20 | 3.5 / 5.3 | 125W / 181W |
| $490 - Ryzen 9 7950X | 86.2% | Zen 4 | 16 / 32 | 4.5 / 5.7 | 170W / 230W |
| $600 - Ryzen 9 7950X3D | 86.1% | Zen 4 | 16 / 32 | 4.2 / 5.7 | 120W / 162W |
| $370 - Ryzen 9 7900X | 85.8% | Zen 4 | 12 / 24 | 4.7 / 5.6 | 170 / 230W |
| $490 - Ryzen 9 7900X3D | 84.6% | Zen 4 | 12 / 24 | 4.4 / 5.6 | 120W / 162W |
| $220 - Ryzen 5 7600X | 84.2% | Zen 4 | 6 / 12 | 4.7 / 5.3 | 105 / 142W |
| $225 - Core i5-13600K | 83.9% | Raptor Lake | 14 / 20 (6+8) | 3.5 / 5.1 | 125W / 181W |
| $300 - Ryzen 7 7700X | 83.4% | Zen 4 | 8 / 16 | 4.5 / 5.4 | 105 / 142W |
| $280 - Core i9-12900K | 81.5% | Alder Lake | 16 / 24 (8+8) | 3.2 / 5.2 | 125 / 241W |
| $209 - Core i7-12700K | 81.2% | Alder Lake | 12 / 20 (8+4) | 3.6 / 5.0 | 125W / 190W |
| $150 - Core i5-12600K | 79.7% | Alder Lake | 10 / 16 (6+4) | 3.7 / 4.9 | 125W / 150W |
| $460 - Ryzen 7 7800X3D | 77.5% | Zen 4 | 8 / 16 | 4.2 / 5.0 | 120W / 162W |
| $210 - Core i5-14400 | 76.6% | Raptor Lake Refresh | 10 / 16 (6+4) | 2.5 / 4.7 | 65W / 148W |
| $300 - Ryzen 5 7600X3D | 73.9% | Zen 4 | 6 / 12 | 4.1 / 4.7 | 65W / 88W |
| $220 - Ryzen 7 5700X3D | 61.1% | Zen 3 | 8 / 16 | 3.0 / 4.1 | 105 / 142W |
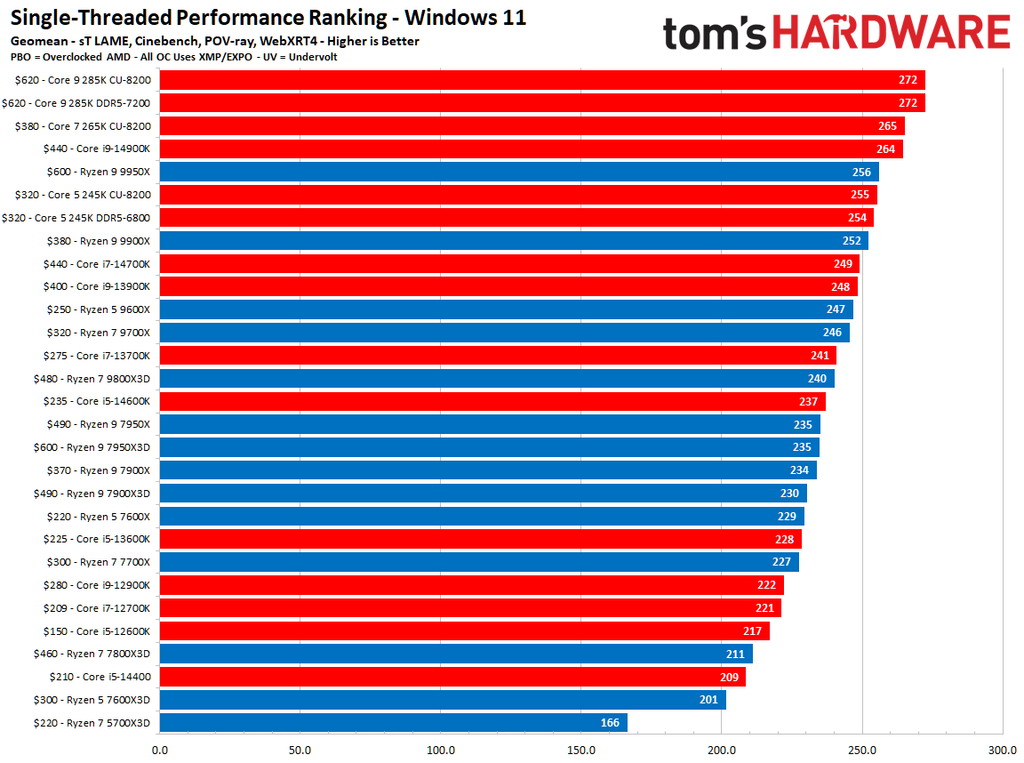
We calculate the above single-threaded CPU benchmark rankings based on a geometric mean of the Cinebench, POV-Ray, WebXPRT4, and LAME CPU benchmarks. The most powerful chip gets a 100, and all others are scored relative to it.
Single-threaded performance is often tied directly to the responsiveness and snappiness of your PC in any number of daily applications, like loading an operating system or surfing the web. This metric largely depends upon a mixture of instruction per cycle (IPC) throughput (the number of operations the chip can execute in one clock cycle) and frequency, which is the speed at which the transistors switch between on and off states.
However, a whole host of other considerations, such as cache, architecture, and interconnects (like rings, meshes, and infinity fabric) impact this measure of per-core performance, so these results do not align perfectly based on clock frequency. Instead, performance varies with each application and how well it is tuned for the respective architectures.
Multi-Threaded CPU Benchmarks Rankings 2024
| Multi-Threaded App Score | Architecture | Cores/Threads (P+E) | Base/Boost GHz | TDP / PBP / MTP | |
|---|---|---|---|---|---|
| $600 - Ryzen 9 9950X | 100% | Zen 5 | 16 / 32 | 4.3 / 5.7 | 170W / 230W |
| $620 - Core 9 285K CU-8200 | DDR5-7200 | 95.6% | 95.0% | Arrow Lake | 24 / 24 (8+16) | 3.7 / 5.7 | 125W / 250W |
| $490 - Ryzen 9 7950X | 89.0% | Zen 4 | 16 / 32 | 4.2 / 5.7 | 120W / 162W |
| $600 - Ryzen 9 7950X3D | 84.4% | Zen 4 | 16 / 32 | 4.2 / 5.7 | 120W / 162W |
| $440 - Core i9-14900K | 82.6% | Raptor Lake Refresh | 24 / 32 (8+16) | 3.2 / 6.0 | 125W / 253W |
| $380 - Core 7 265K CU-8200 | 82.6% | Arrow Lake | 20 / 20 (8+12) | 3.9 / 5.5 | 125W / 250W |
| $400 - Core i9-13900K | 80.7% | Raptor Lake | 24 / 32 (8+16) | 3.0 / 5.8 | 125 / 253W |
| $380 - Ryzen 9 9900X | 78.2% | Zen 5 | 12 / 24 | 4.4 / 5.6 | 120W / 162W |
| $440 - Core i7-14700K | 73.1% | Raptor Lake Refresh | 20 / 28 | 3.4 / 5.6 | 125W / 253W |
| $370 - Ryzen 9 7900X | 69.0% | Zen 4 | 12 / 24 | 4.7 / 5.6 | 170W / 230W |
| $275 - Core i7-13700K | 64.8% | Raptor Lake | 16 / 24 (8+8) | 3.4 / 5.4 | 125W / 253W |
| $490 - Ryzen 9 7900X3D | 63.6% | Zen 4 | 12 / 24 | 4.4 / 5.6 | 120W / 162W |
| $280 - Core i9-12900K | 59.1% | Alder Lake | 16 / 24 (8+8) | 3.2 / 5.2 | 125 / 241W |
| $480 - Ryzen 7 9800X3D | 58.3% | Zen 5 | 8 / 16 | 4.7 / 5.2 | 120W / 162W |
| $320 - Core 5 245K CU-8200 | DDR5-7200 | 57.3% | 56.9% | Arrow Lake | 14 / 14 (6+8) | 4.2 / 5.2 | 125W / 250W |
| $320 - Ryzen 7 9700X | 55.9% | Zen 5 | 8 /16 | 3.8 / 5.5 | 65W / 88W / 105W |
| $235 - Core i5-14600K | 52.7% | Raptor Lake Refresh | 14 / 20 | 3.5 / 5.3 | 125W / 181W |
| $225 - Core i5-13600K | 51.7% | Raptor Lake | 14 / 20 (6+8) | 3.5 / 5.1 | 125W / 181W |
| $209 - Core i7-12700K | 50.3% | Alder Lake | 12 / 20 (8+4) | 3.6 / 5.0 | 125W / 190W |
| $300 - Ryzen 7 7700X | 47.0% | Zen 4 | 8 / 16 | 4.5 / 5.4 | 105 / 142W |
| $460 - Ryzen 7 7800X3D | 43.5% | Zen 4 | 8 / 16 | 4.2 / 5.0 | 120W / 162W |
| $250 - Ryzen 5 9600X | 65W / 88W | Zen 5 | 6 / 12 | 3.9 / 5.4 | 65W / 88W |
| $150 - Core i5-12600K | 38.4% | Alder Lake | 10 / 16 (6+4) | 3.7 / 4.9 | 125W / 150W |
| $220 - Ryzen 5 7600X | 36.2% | Zen 4 | 6 / 12 | 4.7 / 5.3 | 105W / 142W |
| $210 - Core i5-14400 | 35.3% | Raptor Lake Refresh | 10 / 16 (6+4) | 2.5 / 4.7 | 65W / 148W |
| $300 - Ryzen 5 7600X3D | 32.8% | Zen 4 | 6 / 12 | 4.1 / 4.7 | 65W / 88W |
| $220 - Ryzen 7 5700X3D | 32.0% | Zen 3 | 8 / 16 | 3.0 / 4.1 | 105 / 142W |
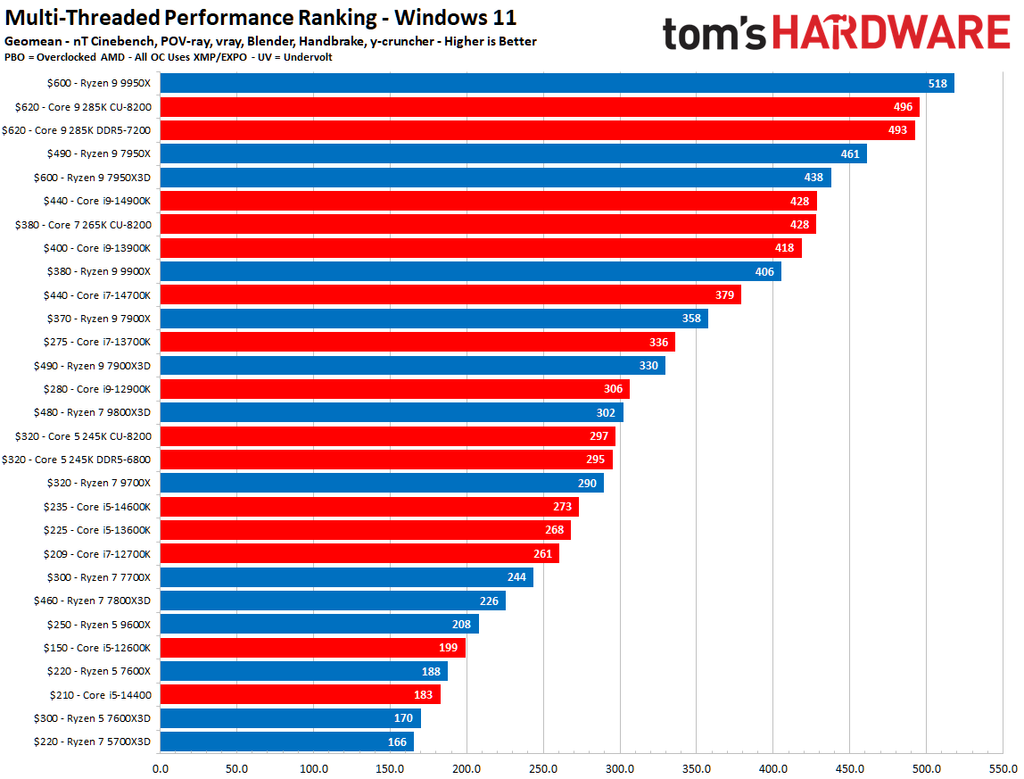
The multi-threaded workload column is based on CPU benchmarks performance in Cinebench, POV-ray, vray, Blender (four tests - Koro, Barcellona, Classroom, bmw27), y-cruncher, and Handbrake x264 and x265 workloads. These CPU benchmarks represent performance in productivity-focused applications that tend to require more compute horsepower. The most powerful chip gets a 100, and all others are scored relative to it.
As we see with single-threaded performance metrics, multi-threaded performance, which measures a chip's performance in applications that utilize multiple software threads, varies based on a whole host of architectural factors. It also depends heavily upon how well the software scales with additional compute cores. As such, these results do not align perfectly based on core/thread count, though it does serve as a decent litmus of multi-threaded performance.
Be aware that architectures, caches, and interconnects profoundly impact these results, as all of these factors impact how well performance scales with additional threads. Performance rarely scales perfectly with the addition of more cores/threads, so the scaling factor of each processor architecture weighs heavily on the value proposition of going with a higher core count processor.
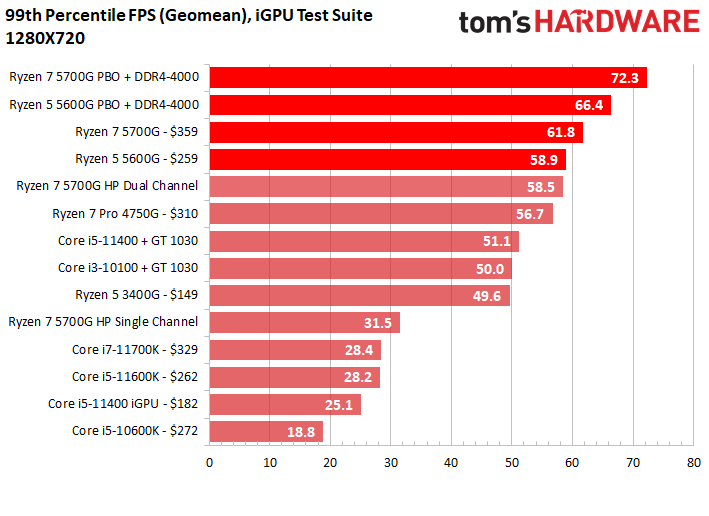
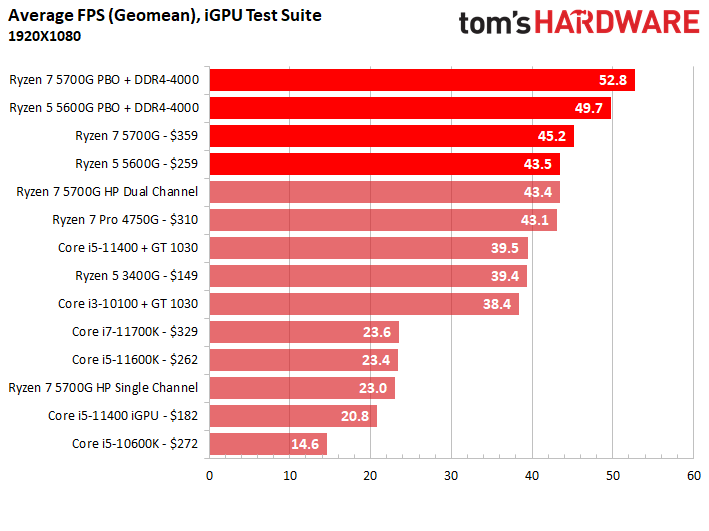
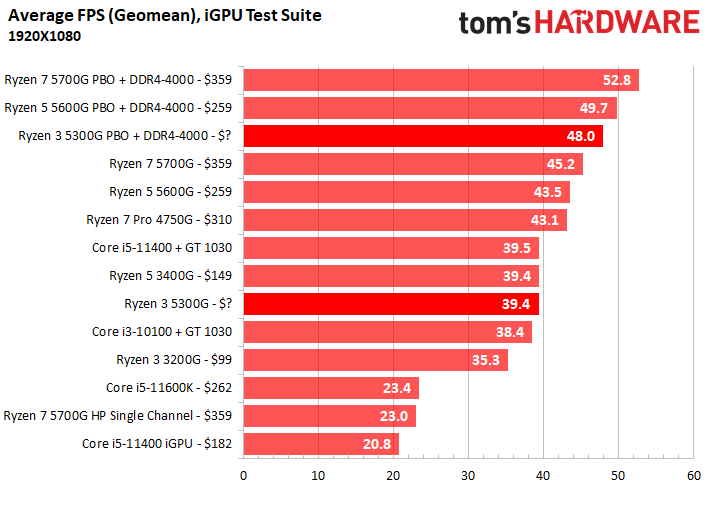
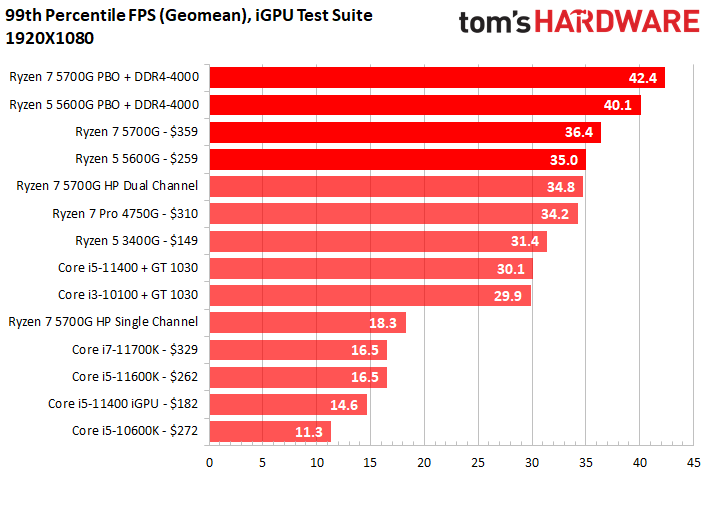
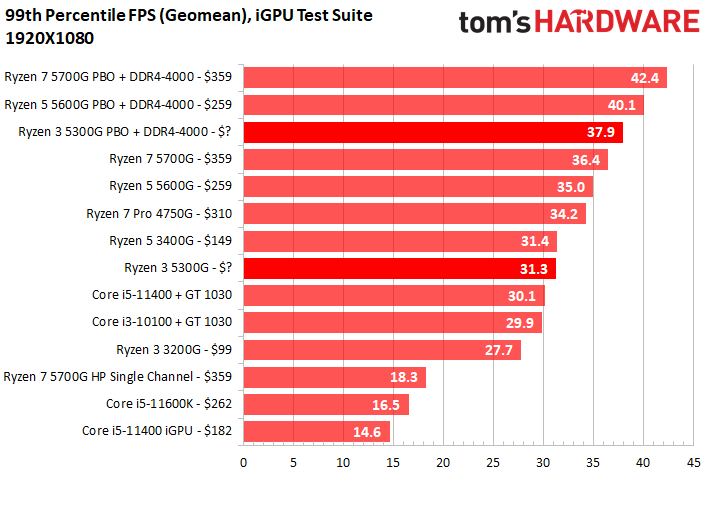
Integrated GPU Gaming CPU Benchmarks Rankings 2024
(Image credit: Tom's Hardware)
(Image credit: Tom's Hardware)
(Image credit: Tom's Hardware)
(Image credit: Tom's Hardware)
(Image credit: Tom's Hardware)
(Image credit: Tom's Hardware)
(Image credit: Tom's Hardware)
(Image credit: Tom's Hardware)
| 1280x720 | 1920x1080 | |
| Ryzen 7 5700G B550-E | 100% | 100% |
| Ryzen 5 5600G | 96.3% | 96% |
| Ryzen 7 4750G | 92.9% | 94.1% |
| Ryzen 3 5300G | 85.8% | 87.2% |
| Ryzen 5 3400G | 83.5% | 84.1% |
| Ryzen 3 3200G | 77.1% | 78.1% |
| Intel UHD Graphics 750 32 EU (11600K, 11700K) | 58.3% | ~48.9% |
| Intel UHD Graphics 730 24 EU (i5-11400) | 51.7% | 42.9% |
| Intel UHD Graphics 630 24 EU (10600K) | 36.0% | 34.4% |
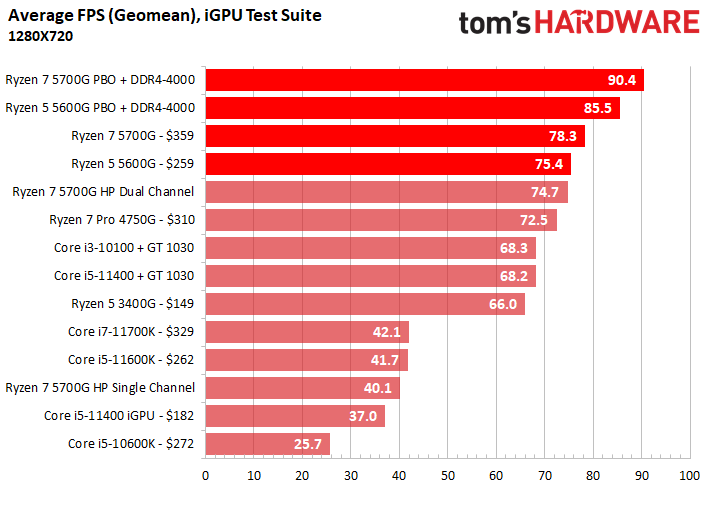
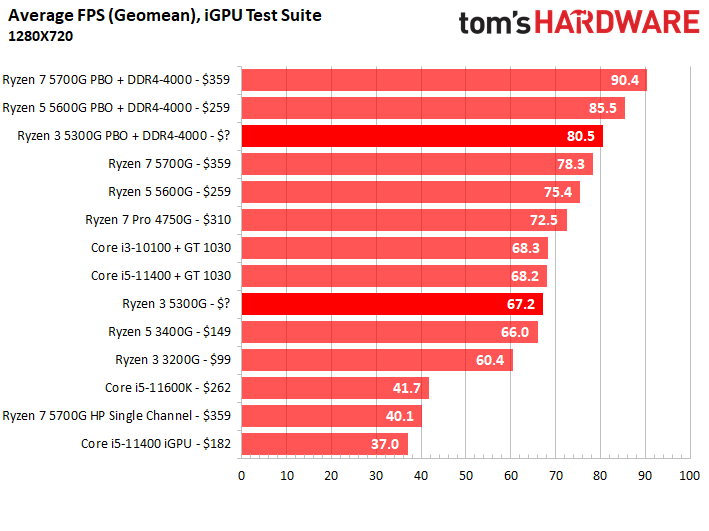
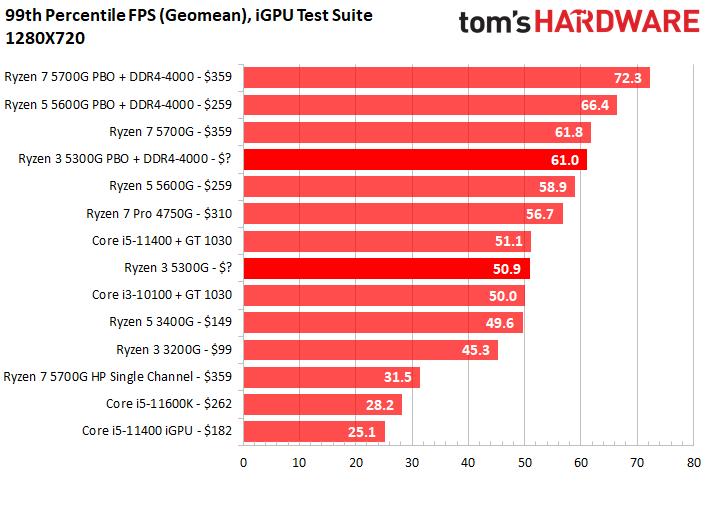
Here's our list of gaming performance with integrated graphics on several of the leading APUs available. We've split this into two different price ranges, so be sure to flip through all of the performance charts. For a bit of commentary and analysis of these results, head to our Ryzen 7 5700G, Ryzen 5 5600G, and Ryzen 3 5300G reviews. The most powerful chip gets a 100, and all others are scored relative to it.
How to Benchmark your CPU
Benchmarking your CPU is an essential practice for CPU overclocking, or if you're merely tuning your system. Simply run a CPU benchmark before you make any changes, then re-test after changes to see the results. You can head to our deep-dive details of overclocking in our How to Overclock a CPU guide for more details on tuning your processor, but if you want to learn how to benchmark your CPU, you're in the right place.
How do you benchmark your CPU? Well, that's not as complicated as you might think. Choosing the best CPU benchmarks can be a daunting task, but the general rule is that the best performance benchmark is simply measuring the performance of the programs you use the most. However, you might not be able to find other benchmarks to compare to, so these real-world benchmarks might not help you compare your performance to other CPUs.
However, if the programs you frequently use don't have built-in benchmarks you can also use similar types of programs (renderers or encoders, for instance) as a proxy for your workload. There are also several well-known benchmarks with large databases that enable easy comparisons. You can also compare your results to the benchmarks you see in our library of reviews to get a good sense of how your system stacks up. We have a list of some great productivity benchmarks, and their download links, below.
These same theories apply to CPU game benchmarking — the best CPU benchmark is the game that you play the most. You can download an fps counter, like FRAPS, to measure performance during your gaming session. Games can vary widely, so we don't have a specific list of titles to test. However, you can use the gaming CPU benchmarks you see in our reviews as a good starting point.
You can also use synthetic gaming CPU benchmarks, a few of which we have listed below. Just be aware that these synthetic CPU benchmarks don't tend to translate well to real-world gaming, but they do show us the raw amount of compute power exposed to game engines. However, given their stability and repeatability, these are great benchmarks for comparing performance before and after any changes you may make to your system.
Most often overlook web-browser performance, but these are among the best CPU benchmarks to measure performance in single-threaded workloads, which helps quantify the snappiness in your system. This also often directly correlates to performance in games that prize single-threaded performance. We've included a few web browser benchmarks below as well.
If you plan to compare to other gaming and application CPU benchmark results from reviews, forums, or friends, be sure to turn off as many background tasks as possible during your benchmarks to eliminate that influence from your CPU benchmark results. Here's a list with download links for some of the most common CPU benchmarks:
Best CPU Benchmarks You Can Run
- Cinebench R23 (MS Store) — This rendering CPU benchmark program has both single- and multi-core benchmark modes. This is one of the most commonly-used CPU benchmarks.
- UL Benchmarks 3DMark — This synthetic CPU benchmark has a plethora of built-in tests for both CPUs and GPUs (see our best GPUs) and is updated regularly with new tests. This is the go-to synthetic gaming test for many.
- CPU-Z — This is a common utility that exposes the details of your processor, but it also has a built-in CPU benchmark that is incredibly simple to run. The single- and multi-thread test results don't correlate well to real-world tasks, but the tests' stability makes them well suited for before and after comparisons. CPU-Z test results are also widely shared among enthusiasts, so it's easy to find comparison systems.
- POV-Ray — This rendering CPU benchmark has both single- and multi-threaded test options but uses a heavier distribution of AVX instructions than Cinebench to create a taxing CPU benchmark.
- C-Ray — This CPU benchmark uses a raytracer rendering engine to measure a CPU's multi-threaded performance in floating-point operations.
- HandBrake — The HandBrake encoder comes with a plethora of options, so you can easily tailor the encoding CPU benchmark to your needs. Simply measure the amount of time it takes to encode a video, and then use that as your baseline for comparison.
- Corona — This is another popular rendering utility and is a simple-one click CPU benchmark that uses the Chaos Corona render engine to measure CPU performance in multi-threaded workloads.
- WebXPRT 4 — This is a click-to-run CPU benchmark that runs in your browser to measure performance in HTML5, JavaScript, and WebAssembly-based tests. This is a great CPU benchmark to measure single-threaded performance.
- ARES-6 — This is a click-to-run CPU benchmark that runs in your browser to measure performance in JavaScript but has a heavy weighting towards the neural network (machine learning) workloads that are becoming increasingly common. This is a great CPU benchmark to measure single-threaded performance.
- y-cruncher — This CPU benchmark runs from a command line, so it isn't the most user-friendly. However, it calculates Pi using the latest AVX instruction sets in a heavily-threaded manner, making it among the best to measure SIMD performance. Beware, this test can break overclocks easily (which also means it is great for stress testing).
2024 CPU Benchmarks Test System and Configuration
| Intel Socket 1700 DDR5 (Z790) | Core i9-13900K, i7-13700K, i5-13600K |
| Row 1 - Cell 0 | MSI MPG Z790 Carbon WiFi |
| Row 2 - Cell 0 | G.Skill Trident Z5 RGB DDR5-6800 - Stock: DDR5-5600 | OC: XMP DDR5-6800 |
| AMD Socket AM5 (X670E) | Ryzen 9 7900, Ryzen 7 7600, Ryzen 5 7600, Ryzen 9 7950X, Ryzen 9 7900X, Ryzen 5 7600X |
| Row 4 - Cell 0 | ASRock X670E Taichi |
| Row 5 - Cell 0 | G.Skill Trident Z5 Neo DDR5-6000 - Stock: DDR5-5200 | OC/PBO: DDR5-6000 |
| Intel Socket 1700 DDR5 (Z690) | Core i5-12400, i5-12600K, i7-12700K, i9-12900K |
| Row 7 - Cell 0 | MSI MEG Z690 Ace |
| Row 8 - Cell 0 | G.Skill Trident Z5 DDR5-6400 - Stock: DDR5-4400 | OC DDR5-6000 |
| AMD Socket AM4 (X570) | Ryzen 9 5950X, 5900X, 5700X, 5600X, 5800X3D |
| Row 10 - Cell 0 | MSI MEG X570 Godlike |
| Row 11 - Cell 0 | 2x 8GB Trident Z Royal DDR4-3600 - Stock: DDR4-3200 | OC/PBO: DDR4-3800 |
| All Systems | Asus RTX 4090 ROG Strix OC |
| Row 13 - Cell 0 | Gigabyte GeForce RTX 3090 Eagle - ProViz applications |
| Row 14 - Cell 0 | Nvidia GeForce RTX 2080 Ti FE - Application tests |
| Row 15 - Cell 0 | 2TB Sabrent Rocket 4 Plus, Silverstone ST1100-TI, Open Benchtable, Arctic MX-4 TIM, Windows 11 Pro |
| Cooling | Corsair H115i, Custom loop |
| Overclocking note | All configurations with overclocked memory also have tuned core frequencies and/or lifted power limits. |
- AMD Ryzen 7 7800X3D vs Intel Core i9-13900K vs Core i7-13700K: Big Gaming Punch, Smaller Price Tag
- AMD Ryzen 9 7950X3D vs Intel Core i9-13900K Faceoff: Battle of the Gaming Flagships
- Intel Core i5-13600K vs AMD Ryzen 7 7700X and Ryzen 5 7600X Face Off
- AMD Ryzen 9 7950X vs Intel Core i9-13900K Face Off
- Ryzen 7 5800X3D vs Core i7-12700K and Core i9-12900K Face-Off: The Rise of 3D V-Cache
- Intel Core i9-12900K vs Ryzen 9 5900X and 5950X: Alder Lake and Ryzen 5000 Face Off
- Intel Core i5-12600K vs AMD Ryzen 5 5600X and 5800X Face Off: Ryzen Has Fallen
- Intel Core i7-12700K vs AMD Ryzen 9 5900X and 5800X Face Off: Intel Rising
- Intel Core i5-12400 vs AMD Ryzen 5 5600X Face-Off: The Gaming Value Showdown
- MORE: Best CPUs for Gaming
- MORE: AMD vs Intel
- MORE: 13th-Gen Raptor Lake All We Know
- MORE: Zen 4 Ryzen 7000 All We Know
- MORE: How to Overclock a CPU
- MORE: How to check CPU Temperature
- MORE: All CPUs Content
-
 C114 Communication Network
 -
 Communication Home